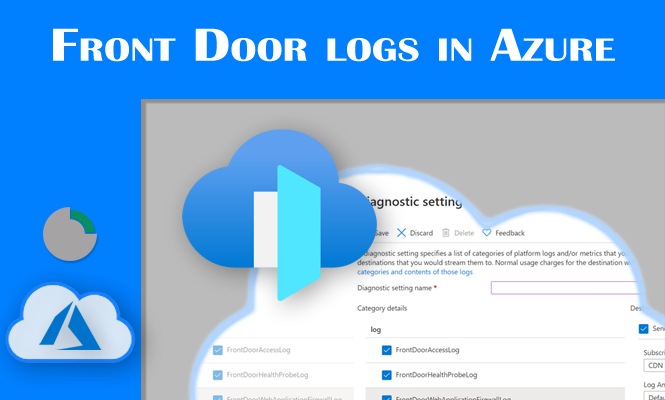
Azure Front Door is a powerful tool for globally distributing web content. To maximize its potential, understanding and analyzing its logs is crucial. This article delves into the various query types and log readings you can perform on Azure Front Door logs to gain valuable insights into your web traffic, identify performance issues, and enhance user experience.
Why Analyze Azure Front Door Logs?
Analyzing logs allows you to:
- Monitor Performance: Identify bottlenecks, errors, and slow response times.
- Evaluate Cache Efficiency: Verify content caching effectiveness and duration.
- Detect Attacks: Identify intrusion attempts and suspicious activity through WAF data.
- Optimize Configuration: Refine routing rules and caching policies based on real-world data.
- Understand User Behavior: Analyze frequent requests, device usage, and geographic locations.
The Basics of Queries on Azure Front Door Logs
Front Door employs the Kusto query language to interrogate its logs. Kusto is a powerful and flexible language that enables complex data analysis.
Simple Query Example: AzureDiagnostics
The AzureDiagnostics table contains most log information. A basic query to view all entries might look like:
AzureDiagnostics
That’s it. There’s nothing else you need to write to get all the information. The only flaw is that this way you would have too much information, confusing the analysis.
We will see more specific examples below with better filters, to deepen the search and find what we are really looking for.
Query Example to Check WAF Blocks:
To identify requests blocked by the WAF, use this query:
AzureDiagnostics
| where action_s == "Block"
Query Example to View Status Codes Greater Than 200:
To view requests resulting in errors (4xx or 5xx status codes), use:
AzureDiagnostics
| where httpStatusCode > 200
Deeper Analysis
Beyond these basic examples, you can customize queries for more specific insights:
- Analyze Requests by URL:
Diagnostics | where url contains "/images/" - Filter by Date and Time:
AzureDiagnostics | where TimeGenerated > ago(1h) - Calculate Metrics:
AzureDiagnostics | summarize count() by bin(TimeGenerated, 1h) - Correlate Data from Different Tables:
AzureDiagnostics | join kind=inner AzureMetrics on TimeGenerated
Advanced Examples and Use Cases
- Identify Top 10 Most Requested URLs:
AzureDiagnostics | summarize count() by url | top 10 by count_ - Calculate Average Response Time by Region:
AzureDiagnostics | where clientIpCountryCode == "US" | summarize avg(duration) by bin(TimeGenerated, 1h) - Analyze the Impact of a Configuration Change: Compare pre- and post-change log data to assess performance and traffic impact.
Conclusion on Azure Front Door logs
Analyzing logs is essential for optimizing web application performance and security. Kusto’s powerful query language allows you to extract valuable insights from your data. Experiment with different queries to uncover hidden potential within your logs.
Additional Tips:
- Utilize a Graphical Interface: Tools like Azure Monitor and Log Analytics provide intuitive interfaces for creating and visualizing queries.
- Set Up Alerts: Configure alerts to be notified of anomalies or critical events.
- Archive Logs: Archive logs long-term for historical analysis and trend identification.
- Share Insights: Share analysis results with development and operations teams for informed decision-making.
By effectively analyzing Azure Front Door logs, you can significantly enhance the performance, security, and scalability of your web applications.
That’s all.
Try it at home!
